
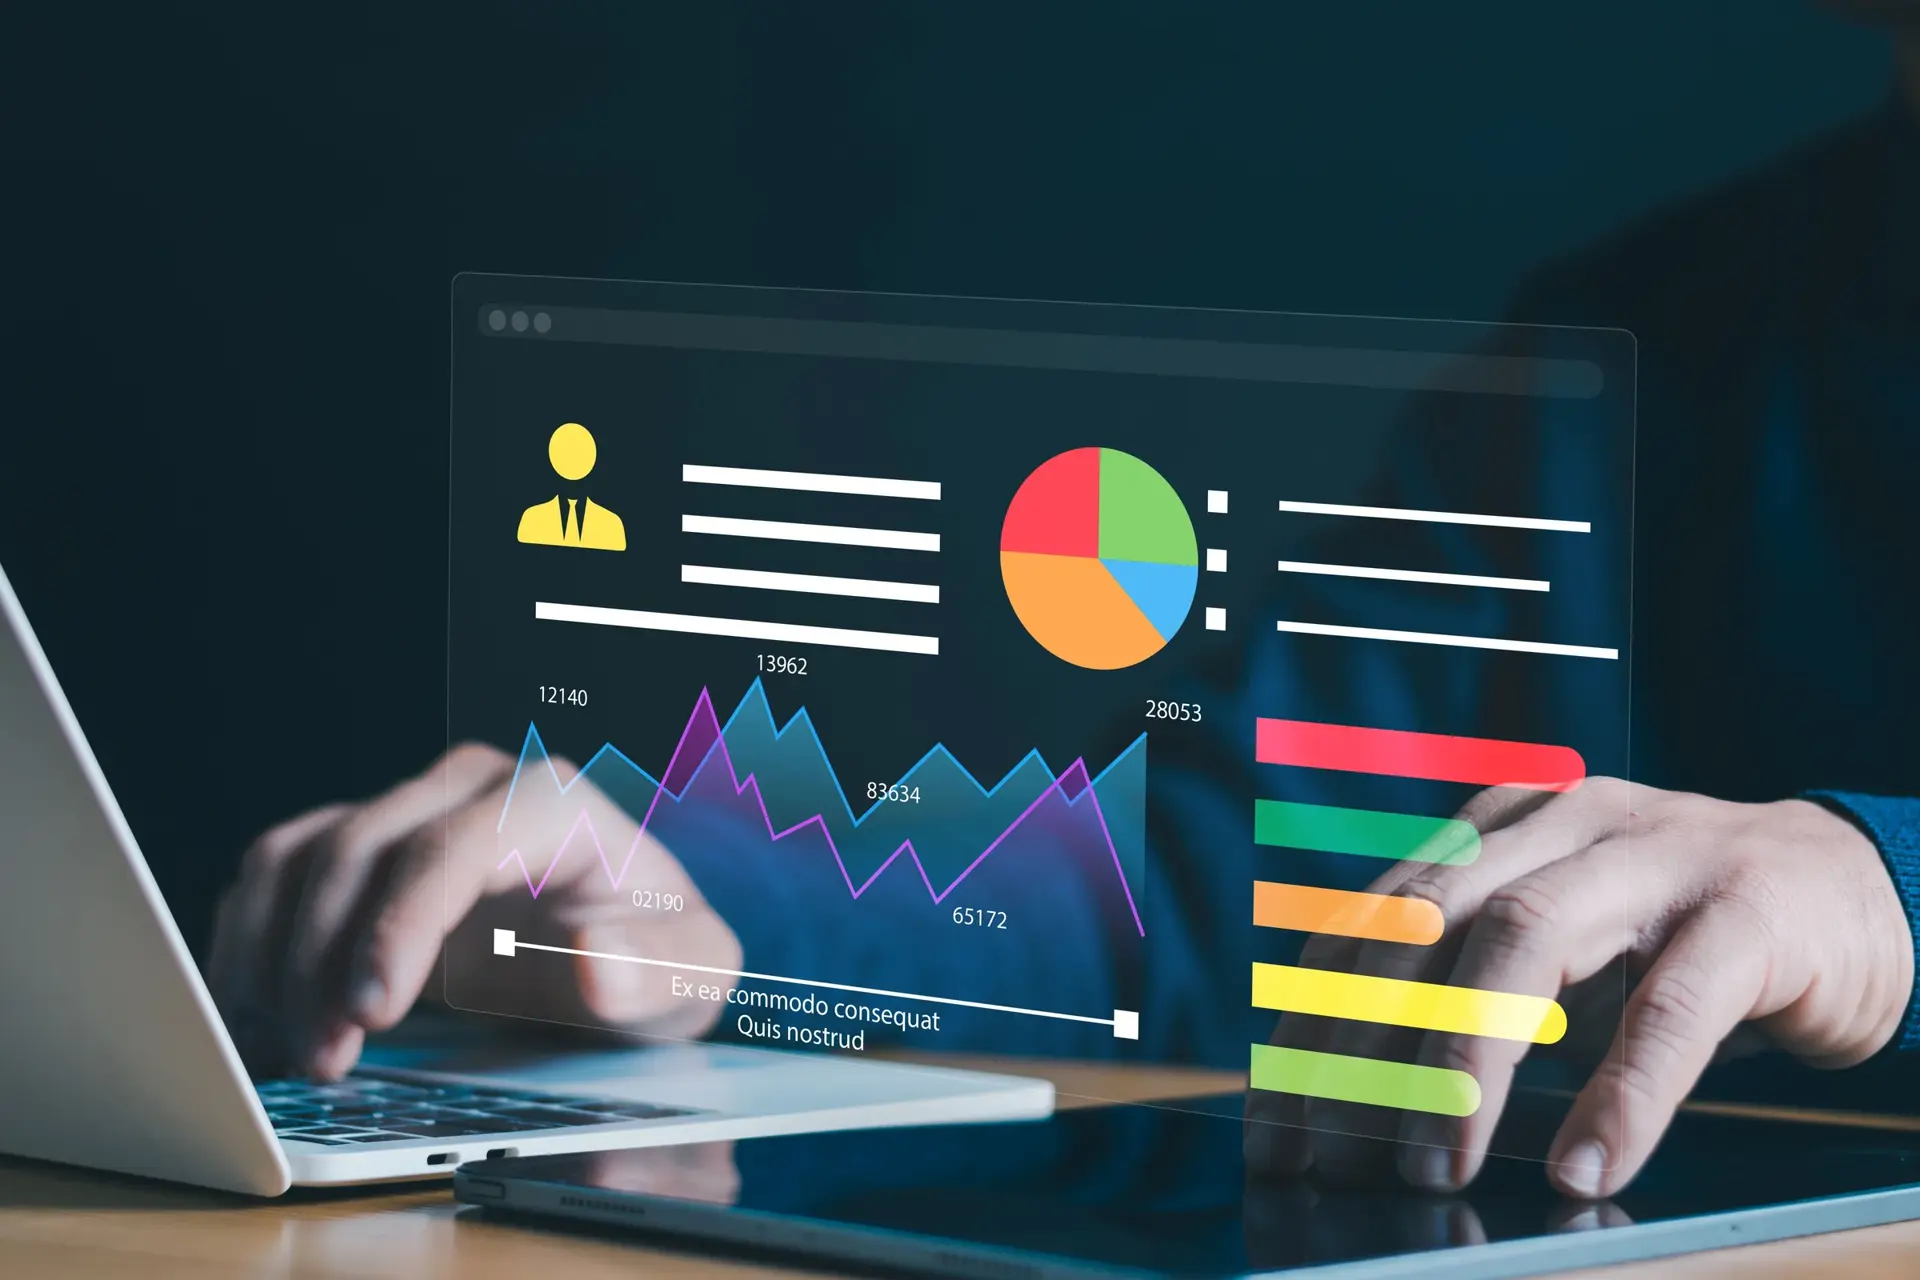
Real-Time Financial Reporting & Analytics that Drives Decisions
Move from rear-view accounting to real-time financial visibility, with automated reporting that pulls live data from your ERP, bank, and sales channels into board-ready dashboards your team can act on today.
Decisions at the Speed of Data
The Old Way
Slow Finance
The Intelegencia Way
Live Finance
The Continuous Close Engine
We move you away from the 'End-of-Month Stress.' By automating bank reconciliation and invoice matching on a daily basis, we enable a 'Continuous Close.' Your books are always 95%+ accurate, allowing you to see your P&L on any Tuesday of the month, not just the third Monday of the next. We provide the 'Financial Heartbeat' that high-growth companies need to scale safely.

Board-Ready Visualization
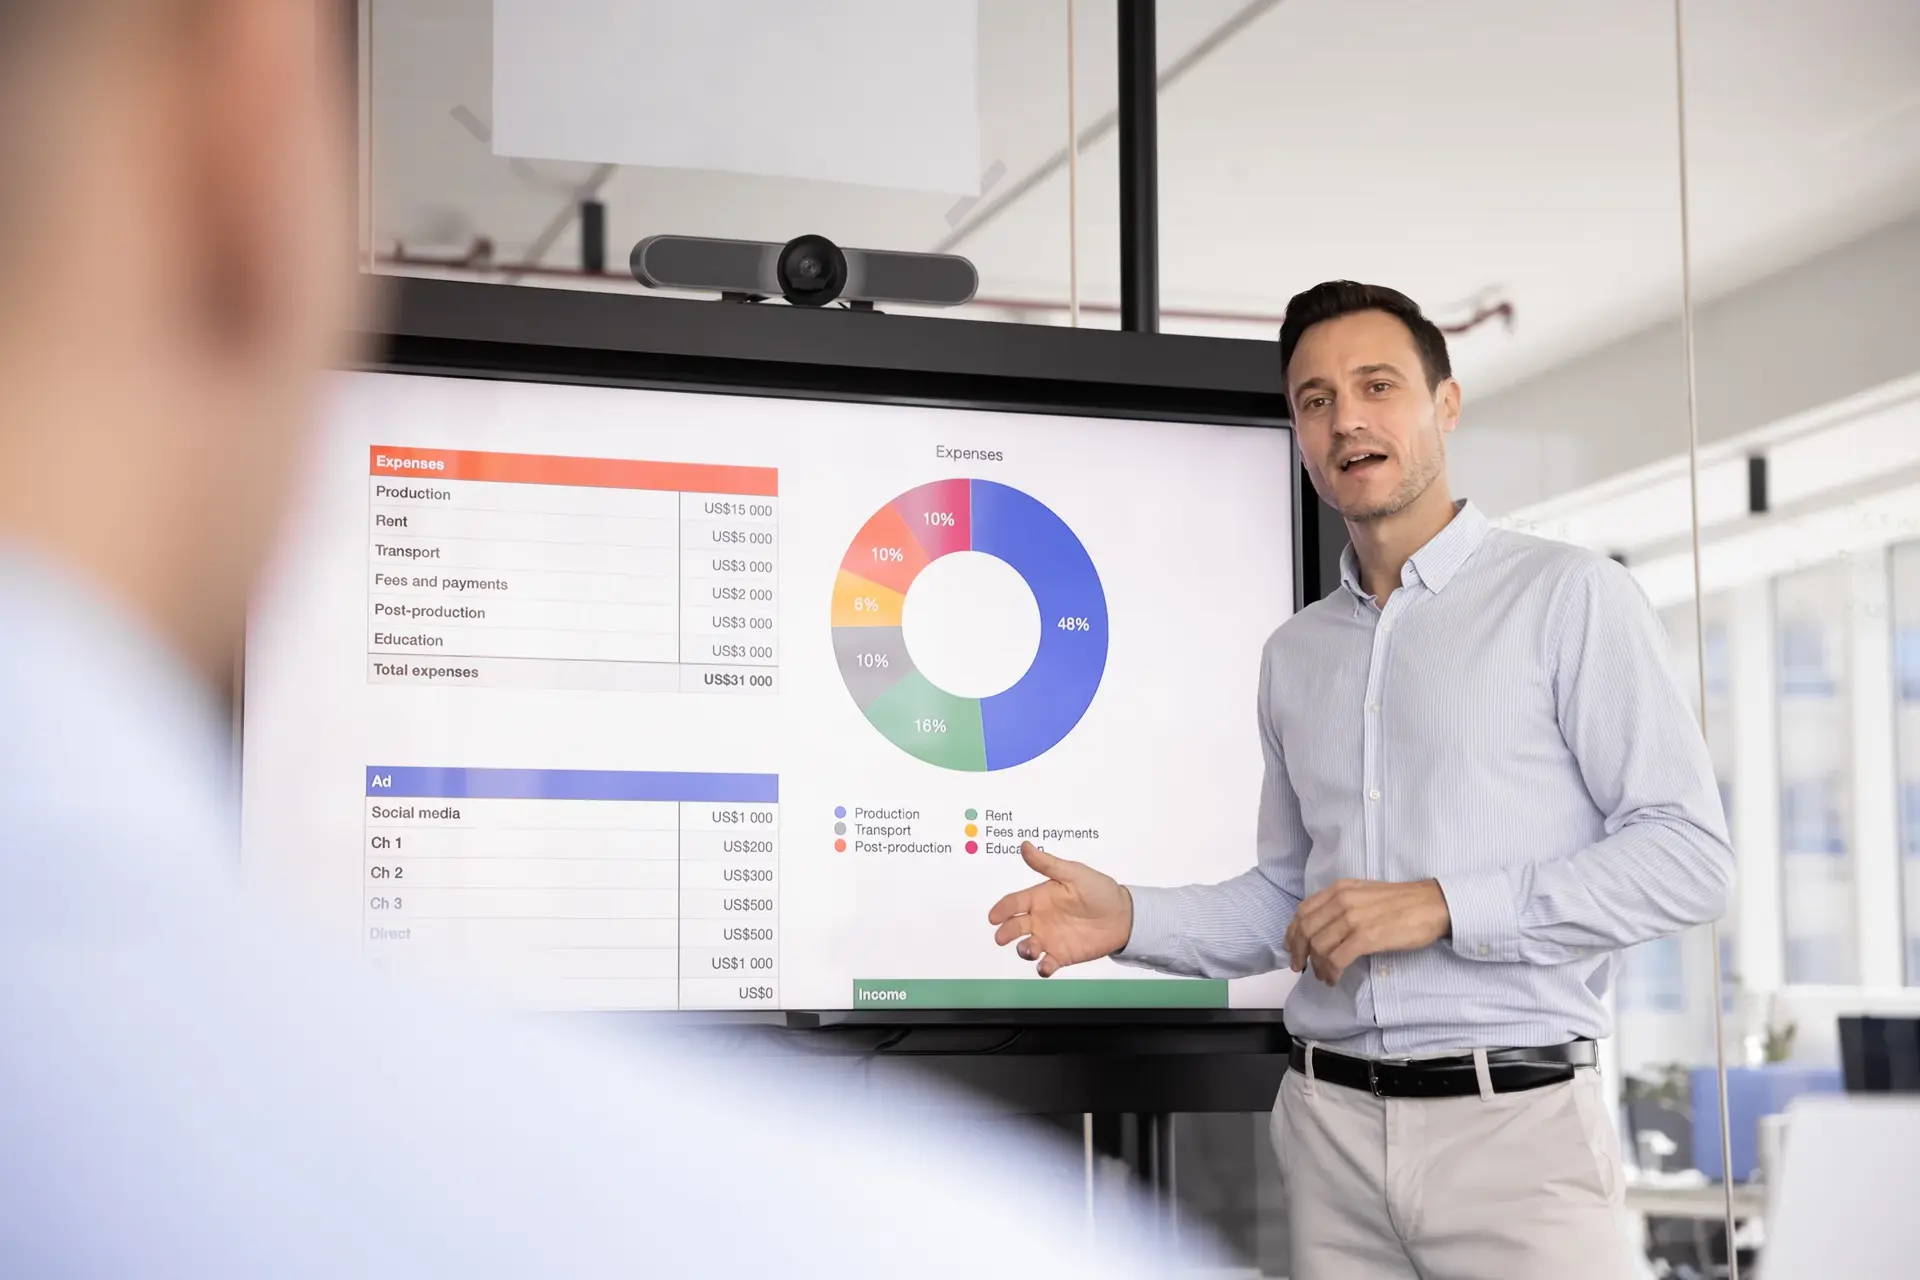
Financial data is only useful if it's understood. We build bespoke dashboards for your Board, your CFO, and your Department Heads. We move beyond 'Data Dumps' to 'Insight Storytelling.' We use tools like Tableau, Power BI, or Looker to visualize your Burn-Rate, LTV/CAC, and Segment Margins. We provide the 'Drill-Down' capability that allows you to move from a global P&L to a single invoice in three clicks.
Predictive Cash-Flow Modeling
Cash is more important than profit. We provide rolling 13-week cash flow forecasts that update automatically based on your actual AR/AP data. We help you see the 'Cash Gaps' before they happen. By modeling different 'What-If' scenarios (e.g., hiring a new team, a delay in a major payment), we give you the tactical foresight needed to manage your treasury with absolute confidence.

Reporting Capabilities
We provide specialized financial intelligence for every tier of your organization.
Multi-Currency Rollup
Unified reporting for global companies with 10+ currencies.
SaaS Metric Desk
Specialized reporting for MRR, Churn, and Net-Revenue Retention.
Inventory Valuation
Real-time auditing of stock-asset values across warehouses.
Compliance Filing
Ensuring all reports meet IFRS or GAAP standards.
Margin Erosion Auditing
Profit often leaks out through thousands of small 'Drips' (incorrect pricing, shipping surcharges, or vendor price-creeps). Our analysts perform deep 'Vertical Audits' to find these leaks. We provide a monthly 'Margin-Protector Report' that identifies exactly where you are losing money and provides actionable recommendations to plug the leaks. We help you keep the profit you've worked so hard to earn.
Our Reporting Roadmap
We implement real-time reporting through a structured data-science and visualization phase.
Data-Lake Setup
Aggregating your ERP, Bank, and CRM data into one secure hub.
Mapping & Logic
Defining the custom KPIs and margin rules for your business.
Dashboard Build
Creating the 'Board-Ready' visualizations for each stakeholder.
Validation Phase
Running the new reports against your manual books for 2 cycles.
Live Insight
24/7 financial visibility with proactive analyst briefings.
Measured Performance. Proven Growth.
Frequently Asked Questions
About Real-Time Financial Reporting & Analytics
Here you will find answers to questions we get asked the most about our offerings.
No. We can build our 'Insight Layer' on top of your existing NetSuite, SAP, QuickBooks, or Xero systems using APIs or secure data exports.