

Executive BI Dashboards & Reporting that Drive Decisions
Transforming complex data into simple, real-time visual narratives that highlight anomalies, track KPIs against targets, and drive faster, more confident decisions at every level of the organization, from the shop floor to the boardroom.
Decision Support
The Old Way
Blind Management
The Intelegencia Way
Visual Mastery
Self-Service Analytics for Every Team
We empower your team to ask their own questions without waiting for the IT department. Business users explore data with natural language queries, drag-and-drop builders, and pre-certified data models they can trust. Mobile-optimized views, scheduled email exports, and automated Slack alerts push the right number to the right person at the right moment, so insight no longer waits on a ticket queue.

Executive-Level KPI Frameworks
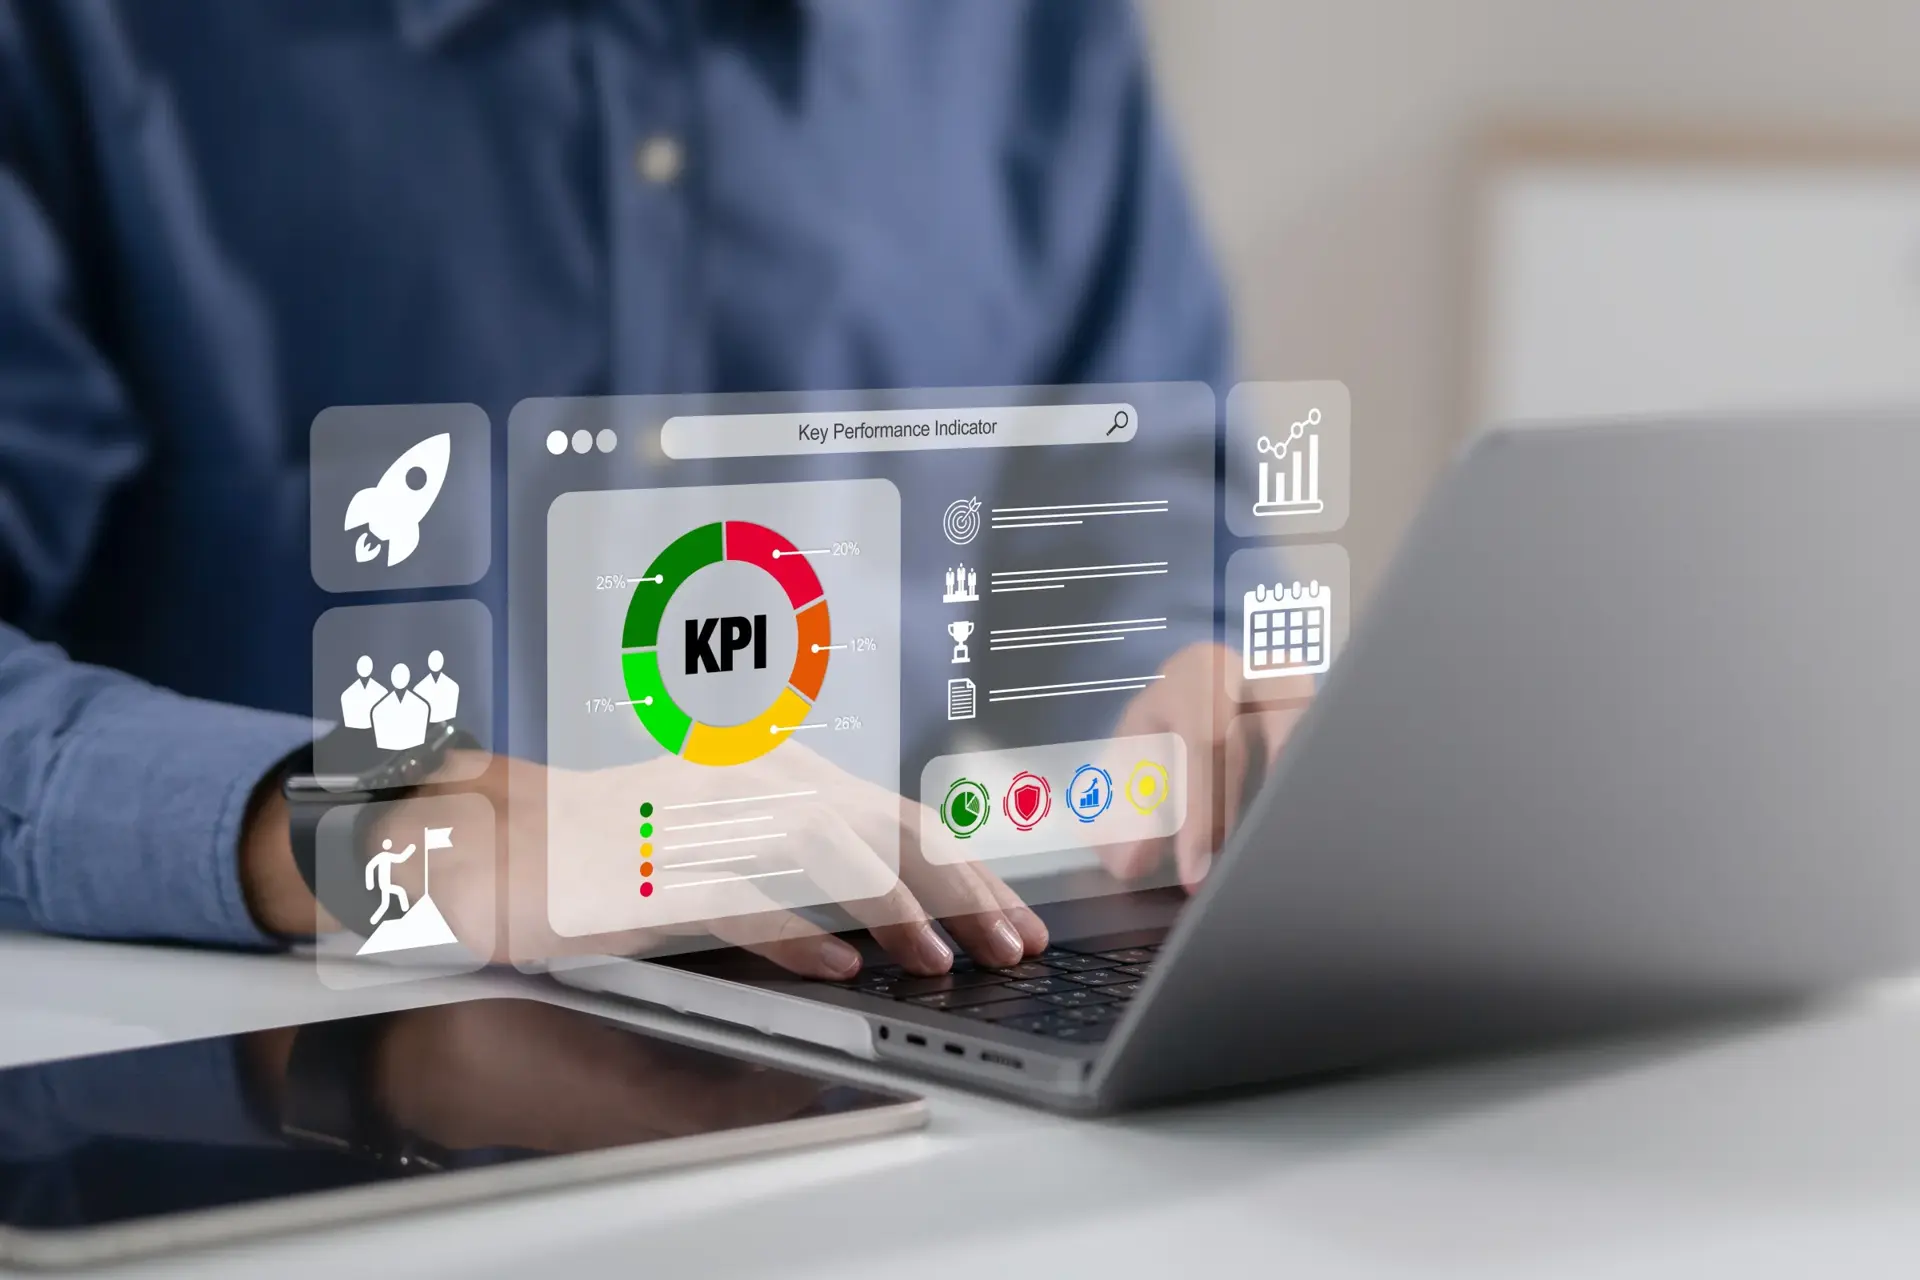
C-suite dashboards need to surface the five metrics that actually move the needle, not 200 data points that paralyze decision-making. We work with leadership to define, instrument, and display the KPIs that reflect business health in real time. Through OKR-alignment workshops and board-ready scorecards, we translate strategy into a handful of leading indicators every executive reads the same way.
Embedded Analytics in Your Products
BI doesn't have to live in a separate tool. We embed analytics directly into your SaaS product or internal platform, giving customers and employees live data insights without ever leaving the workflow they're already in. White-label SDKs, per-tenant row-level security, and API-driven delivery let you ship branded, drill-down dashboards inside your own product without standing up a separate analytics stack.

BI Units
Modules built for every level of the organization: from the shop floor to the boardroom.
Executive View
High-level health metrics and leading indicators for the C-Suite.
Ops Dashboard
Granular, real-time tracking for operations and department managers.
Trend Hunter
AI-powered anomaly detection that surfaces shifts before they become problems.
Goal Tracker
Visualizing progress against quarterly OKRs and revenue targets.
Our BI Roadmap
A systematic approach to visual storytelling that drives measurable business outcomes.
KPI Definition
Identifying the 5 metrics that actually move the needle for your specific business.
Data Wiring
Connecting the dashboard layer to certified, governed data models.
UX Design
Building the layout and interaction model for maximum clarity and speed.
UAT
Testing dashboards with real business users to validate accuracy and usability.
Global Rollout
Training teams to read, interact with, and take action from the data.
Measured Performance. Proven Growth.
Frequently Asked Questions
About Executive BI Dashboards & Reporting
Here you will find answers to questions we get asked the most about our offerings.
We support both. The choice depends on your existing Microsoft or Salesforce ecosystem and your budget. Power BI is typically more cost-effective for Microsoft-heavy organizations; Tableau offers superior visualization flexibility and is the stronger choice for complex, exploratory analytics.