

AI-Enhanced Infographics & Visuals that Make the Complex Simple
Transforming complex data into high-resonance visual assets, infographics, social cards, and technical diagrams, that simplify the complex, hold attention, and drive social sharing across every channel you publish on.
The Power of the Visual
The Old Way
Traditional Design
The Intelegencia Way
AI-Enhanced Design
Algorithmic Data Visualization
Turn dry spreadsheets into compelling visual stories. Our AI identifies the most impactful data points and automatically selects the 'Optimum Visualization Type' to maximize clarity and impact. Whether it's a complex multi-layered chart or a simple comparison graphic, our system ensures that your data isn't just seen, but understood and remembered.


Brand Asset Tuning
Great data design still has to look unmistakably like you. We tune every generated visual to your brand system, color, type, iconography, and spacing, so infographics and social cards feel native to your identity rather than templated. Reusable component libraries keep that consistency across hundreds of assets without a designer rebuilding the basics each time.
Multivariate Layout Variations
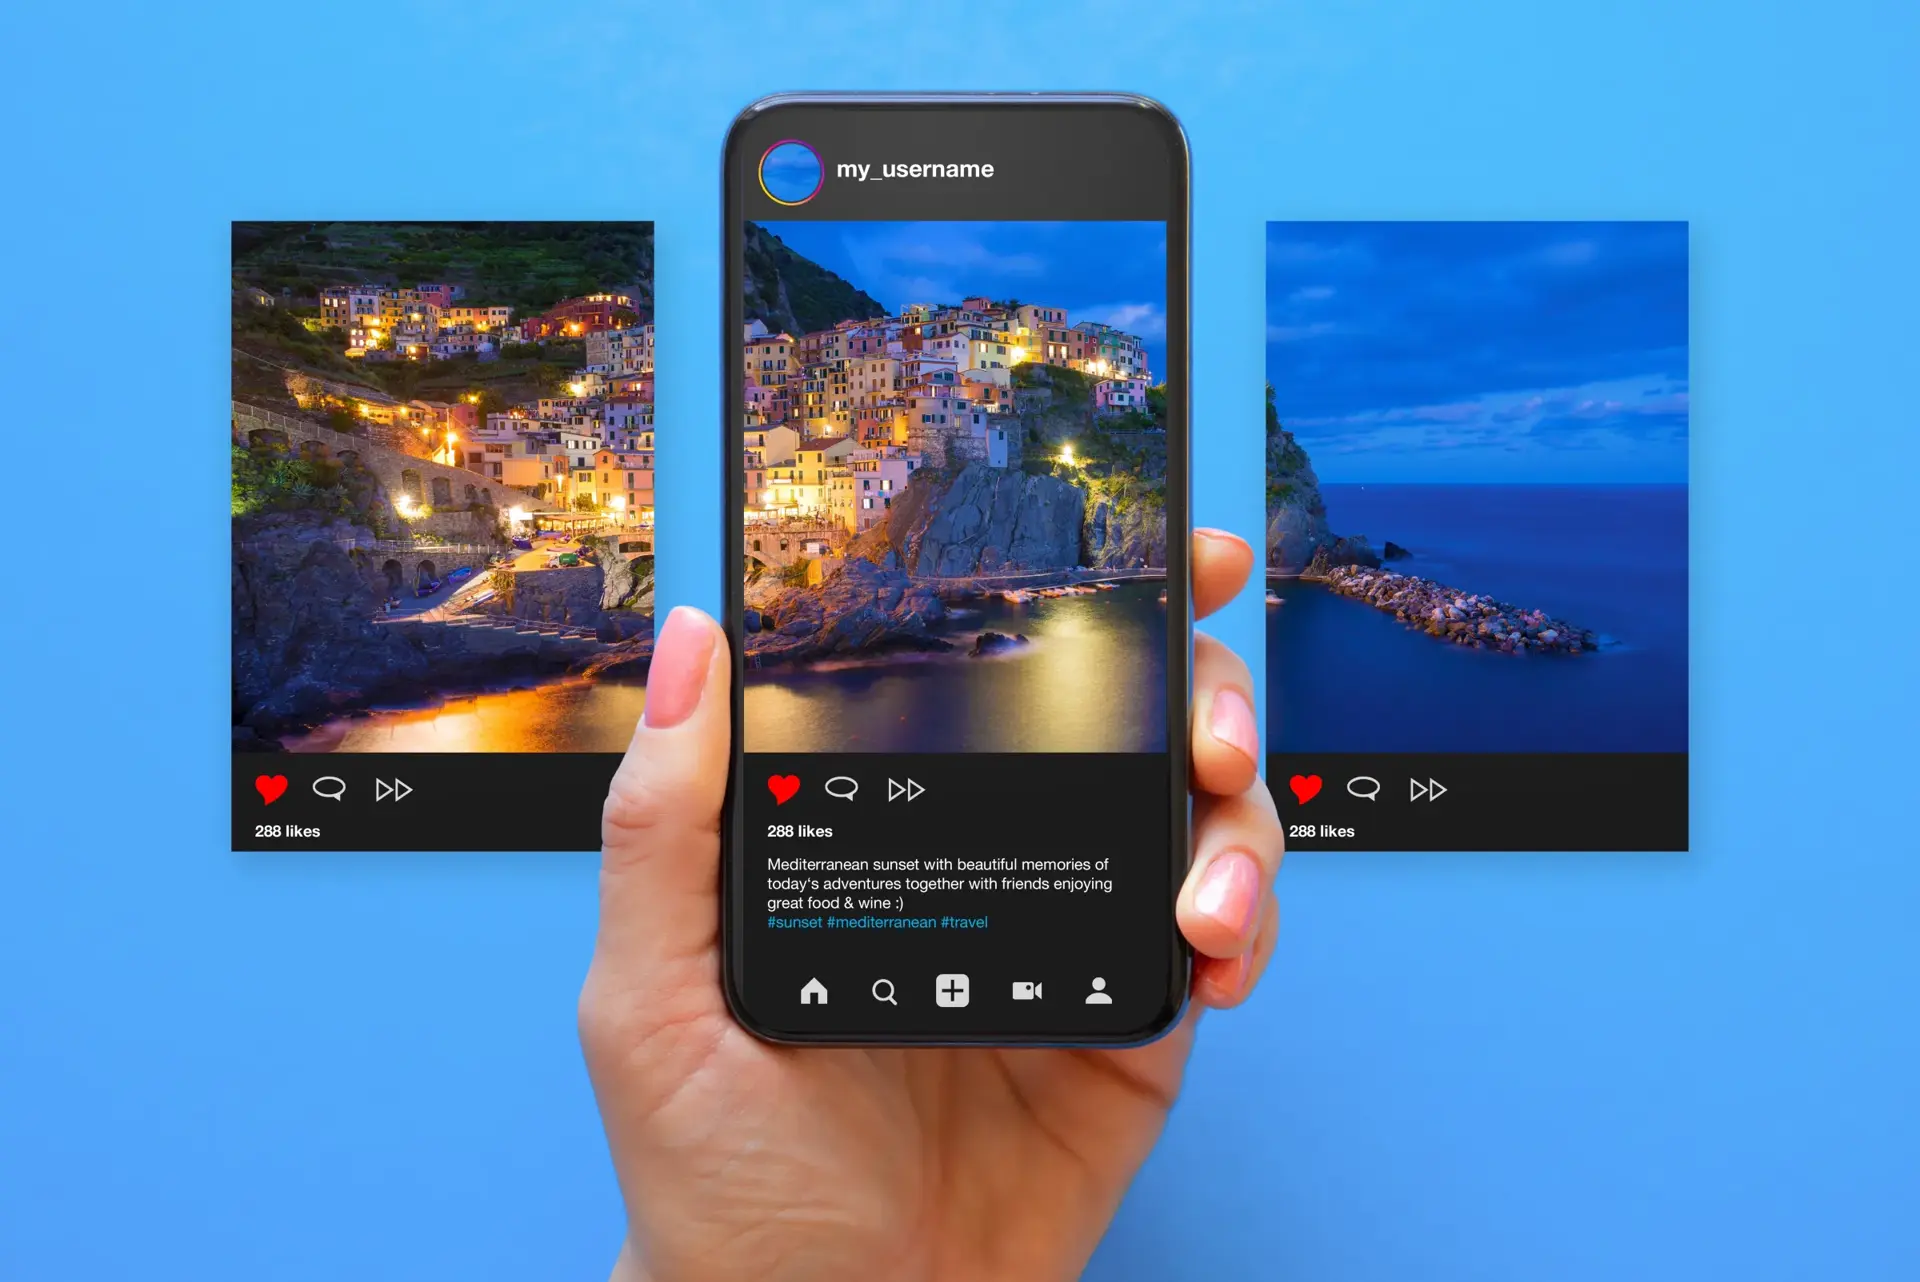
One idea deserves more than one layout. We generate multivariate versions of each visual, different hierarchies, crops, and emphasis, then test which arrangement communicates fastest for your audience. That means a square card for social, a tall cut for stories, and a dense one-pager for executives, all derived from the same insight and proven against real engagement.
Visual Specializations
Transforming complex data into unforgettable visuals across technical diagrams, social cards, executive summaries, and process infographics, each designed to simplify the complex and maximize audience retention.
Technical Diagrams
Simplifying complex architectures and system workflows.
Social Story-Cards
Punchy, high-resonance graphics for LinkedIn and X.
Executive Summaries
Visual one-pagers for high-stakes decision-making.
Process Infographics
Step-by-step visual frameworks for solving business problems.
The Visual Roadmap
Five steps that turn complex data into compelling visuals, covering insight extraction, layout prototyping, resonance testing, creative production, and cross-channel adaptation.
Insight Extraction
Identifying the core message and data points that need to be visualized.
Layout Prototyping
Using AI to generate multiple structural concepts for the visual narrative.
Resonance Testing
Analyzing which visual hooks and styles will best engage your specific audience.
Creative Production
Designers providing the final mile of brand-aligned aesthetic and polish.
Multi-Format Scaling
Automatically adapting the master asset for all social and digital channels.
Measured Performance. Proven Growth.
Frequently Asked Questions
About AI-Enhanced Infographics & Visuals
Here you will find answers to questions we get asked the most about our offerings.
AI excels at 'Structural Logic' and 'Information Hierarchy.' We use AI to build the foundation, and our human designers provide the 'Aesthetic Soul' and brand-specific polish.