

Custom Marketing Dashboards that Consolidate Every Channel
Building real-time marketing dashboards that consolidate data from every channel into a single, decision-ready view so your team always knows what's working and what needs attention.
One View, All Channels
The Old Way
Manual Reporting
The Intelegencia Way
Custom Dashboards
Cross-Channel Data Consolidation
We connect your dashboard to every marketing data source: GA4, Google Ads, Meta Ads, LinkedIn, Klaviyo, HubSpot, Salesforce, and more. We build the automated pipelines that keep every metric current without manual pulling.

KPI Framework & Metric Definition
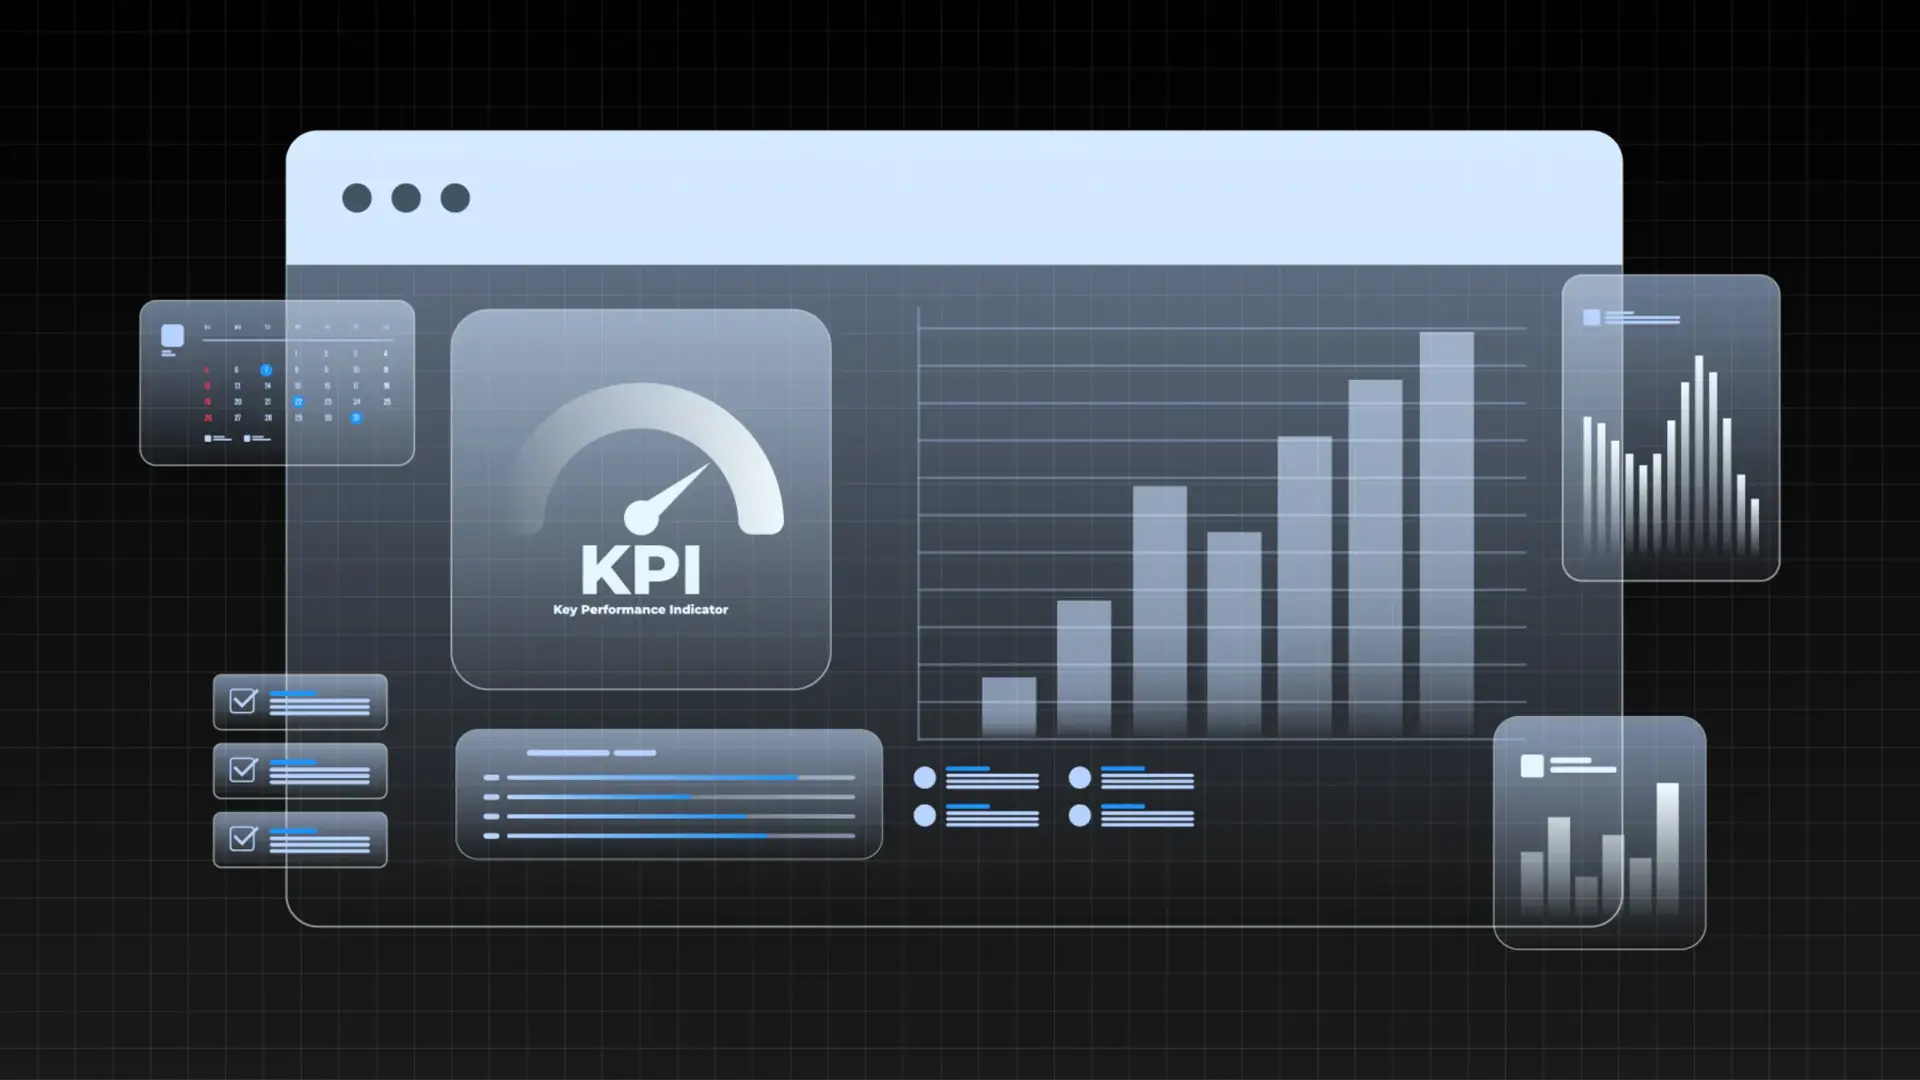
A dashboard is only useful if it tracks the right things. We work with your team to define the business-critical KPIs that belong at the top of your view and design the supporting metrics that help diagnose why those KPIs are moving.
Dashboard Design & Access Control
We build dashboards that are visually clear, role-appropriate, and genuinely useful; not cluttered with every available metric. Each stakeholder gets the view they need, with appropriate access controls and automated delivery.

Operational Dashboards by Industry
Providing custom, decision-ready marketing and sales dashboards built around the KPIs that matter to your sector.
Retail & Commerce
Visualizing customer acquisition cost (CAC), lifetime value (LTV), and real-time inventory yield.
SaaS & Subscription
Tracking monthly recurring revenue (MRR), churn velocity, expansion pipeline, and customer health.
Financial Services
Consolidating loan application funnels, customer acquisition cost, and asset under management trends.
Professional Services
Monitoring lead response velocity, contract values, and channel performance metrics.
Dashboard Build Process
Five-step program moving you from fragmented channel reports to a unified, real-time dashboard framework that consolidates all marketing data and enables your team to make faster decisions.
Stakeholder Discovery
Understanding what decisions each team member needs to make from data.
KPI Framework
Defining the metric hierarchy and benchmark targets for each dashboard.
Data Pipeline Setup
Connecting all sources and building the automated data flows.
Dashboard Design
Building the visualization layer with clear, actionable layouts.
Training & Handover
Training your team on dashboard use and establishing ongoing maintenance protocols.
Measured Performance. Proven Growth.
Frequently Asked Questions
About Custom Marketing Dashboards
Here you will find answers to questions we get asked the most about our offerings.
We build in Looker Studio (Data Studio), Tableau, Power BI, and custom React-based dashboards depending on your tech environment and team.